Leadership teams
Decision makers who need clearer visibility without waiting for manual reporting.
Webits builds reporting and analytics systems that help businesses turn scattered data into clearer views, better questions and practical decisions.
Reporting should help people understand what is happening and what needs attention, not create more charts no one uses.
Webits shapes reporting around the business questions, data sources, quality issues and decisions that need stronger visibility.
Decision makers who need clearer visibility without waiting for manual reporting.
Teams that need reporting on jobs, service delivery, workload, exceptions or performance.
Businesses with useful data spread across systems, exports, spreadsheets or portals.
The useful parts depend on data sources, reporting needs and how the business will use the insight.
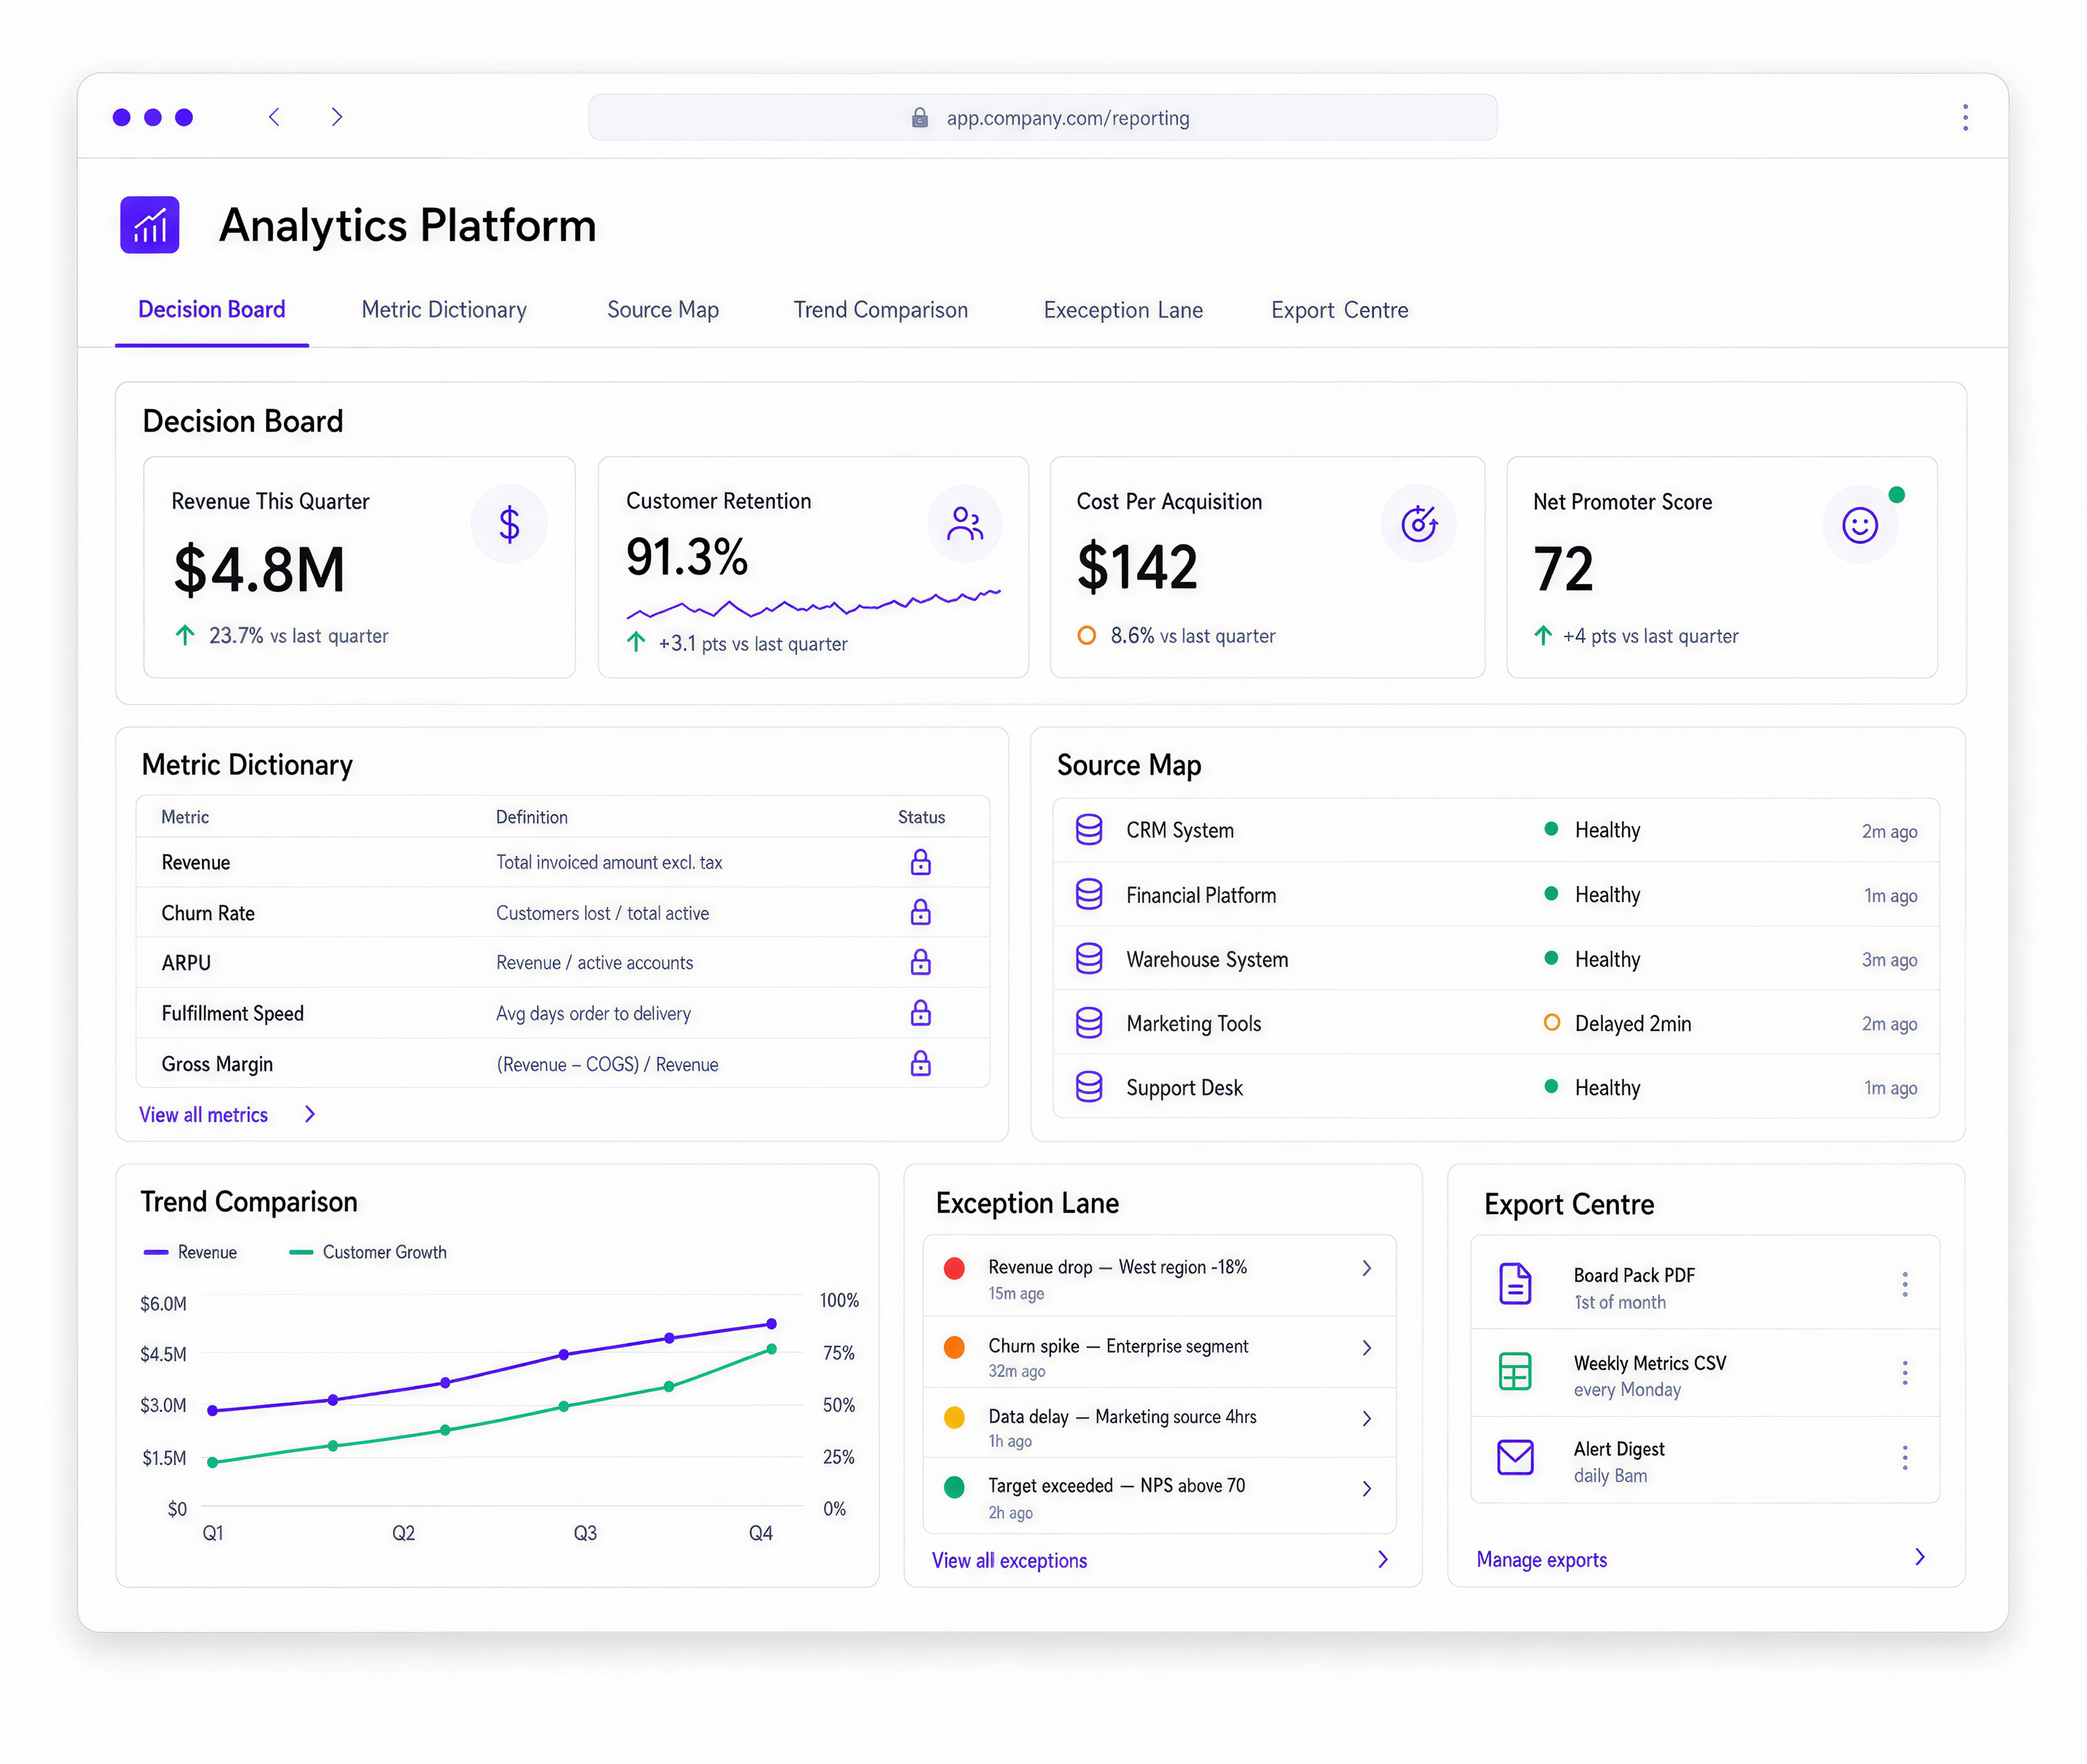
Clear views for performance, workload, customers, finance, operations or exceptions.
Links to CRMs, ERPs, databases, portals, ecommerce tools or operational systems.
Clear definitions for the numbers, statuses and trends that matter.
Comparisons, movement, progress and operational signals over time.
Prompts for unusual activity, missed targets, delays or risk points.
Report outputs, historical records or audit-friendly data where needed.
These are common signs a reporting system needs stronger structure and cleaner data flow.
Reports depend on exports, spreadsheets and manual joins between systems.
The business has data, but not a clear view of what should be measured.
By the time the report is ready, the operational issue has already moved on.
Different reports show different results because definitions and sources are inconsistent.
The build starts with the questions the business needs answered, then connects the data and reporting views.
Clarify what the business needs to understand and decide.
Identify sources, quality issues, ownership and reporting definitions.
Shape dashboards and reports around scanning, comparison and action.
Develop data connections, reporting views, filters and output paths.
Support rollout and improve the reports as real use shows what matters.
A selection of digital products, platforms and business systems engineered for organisations that depend on technology every day.
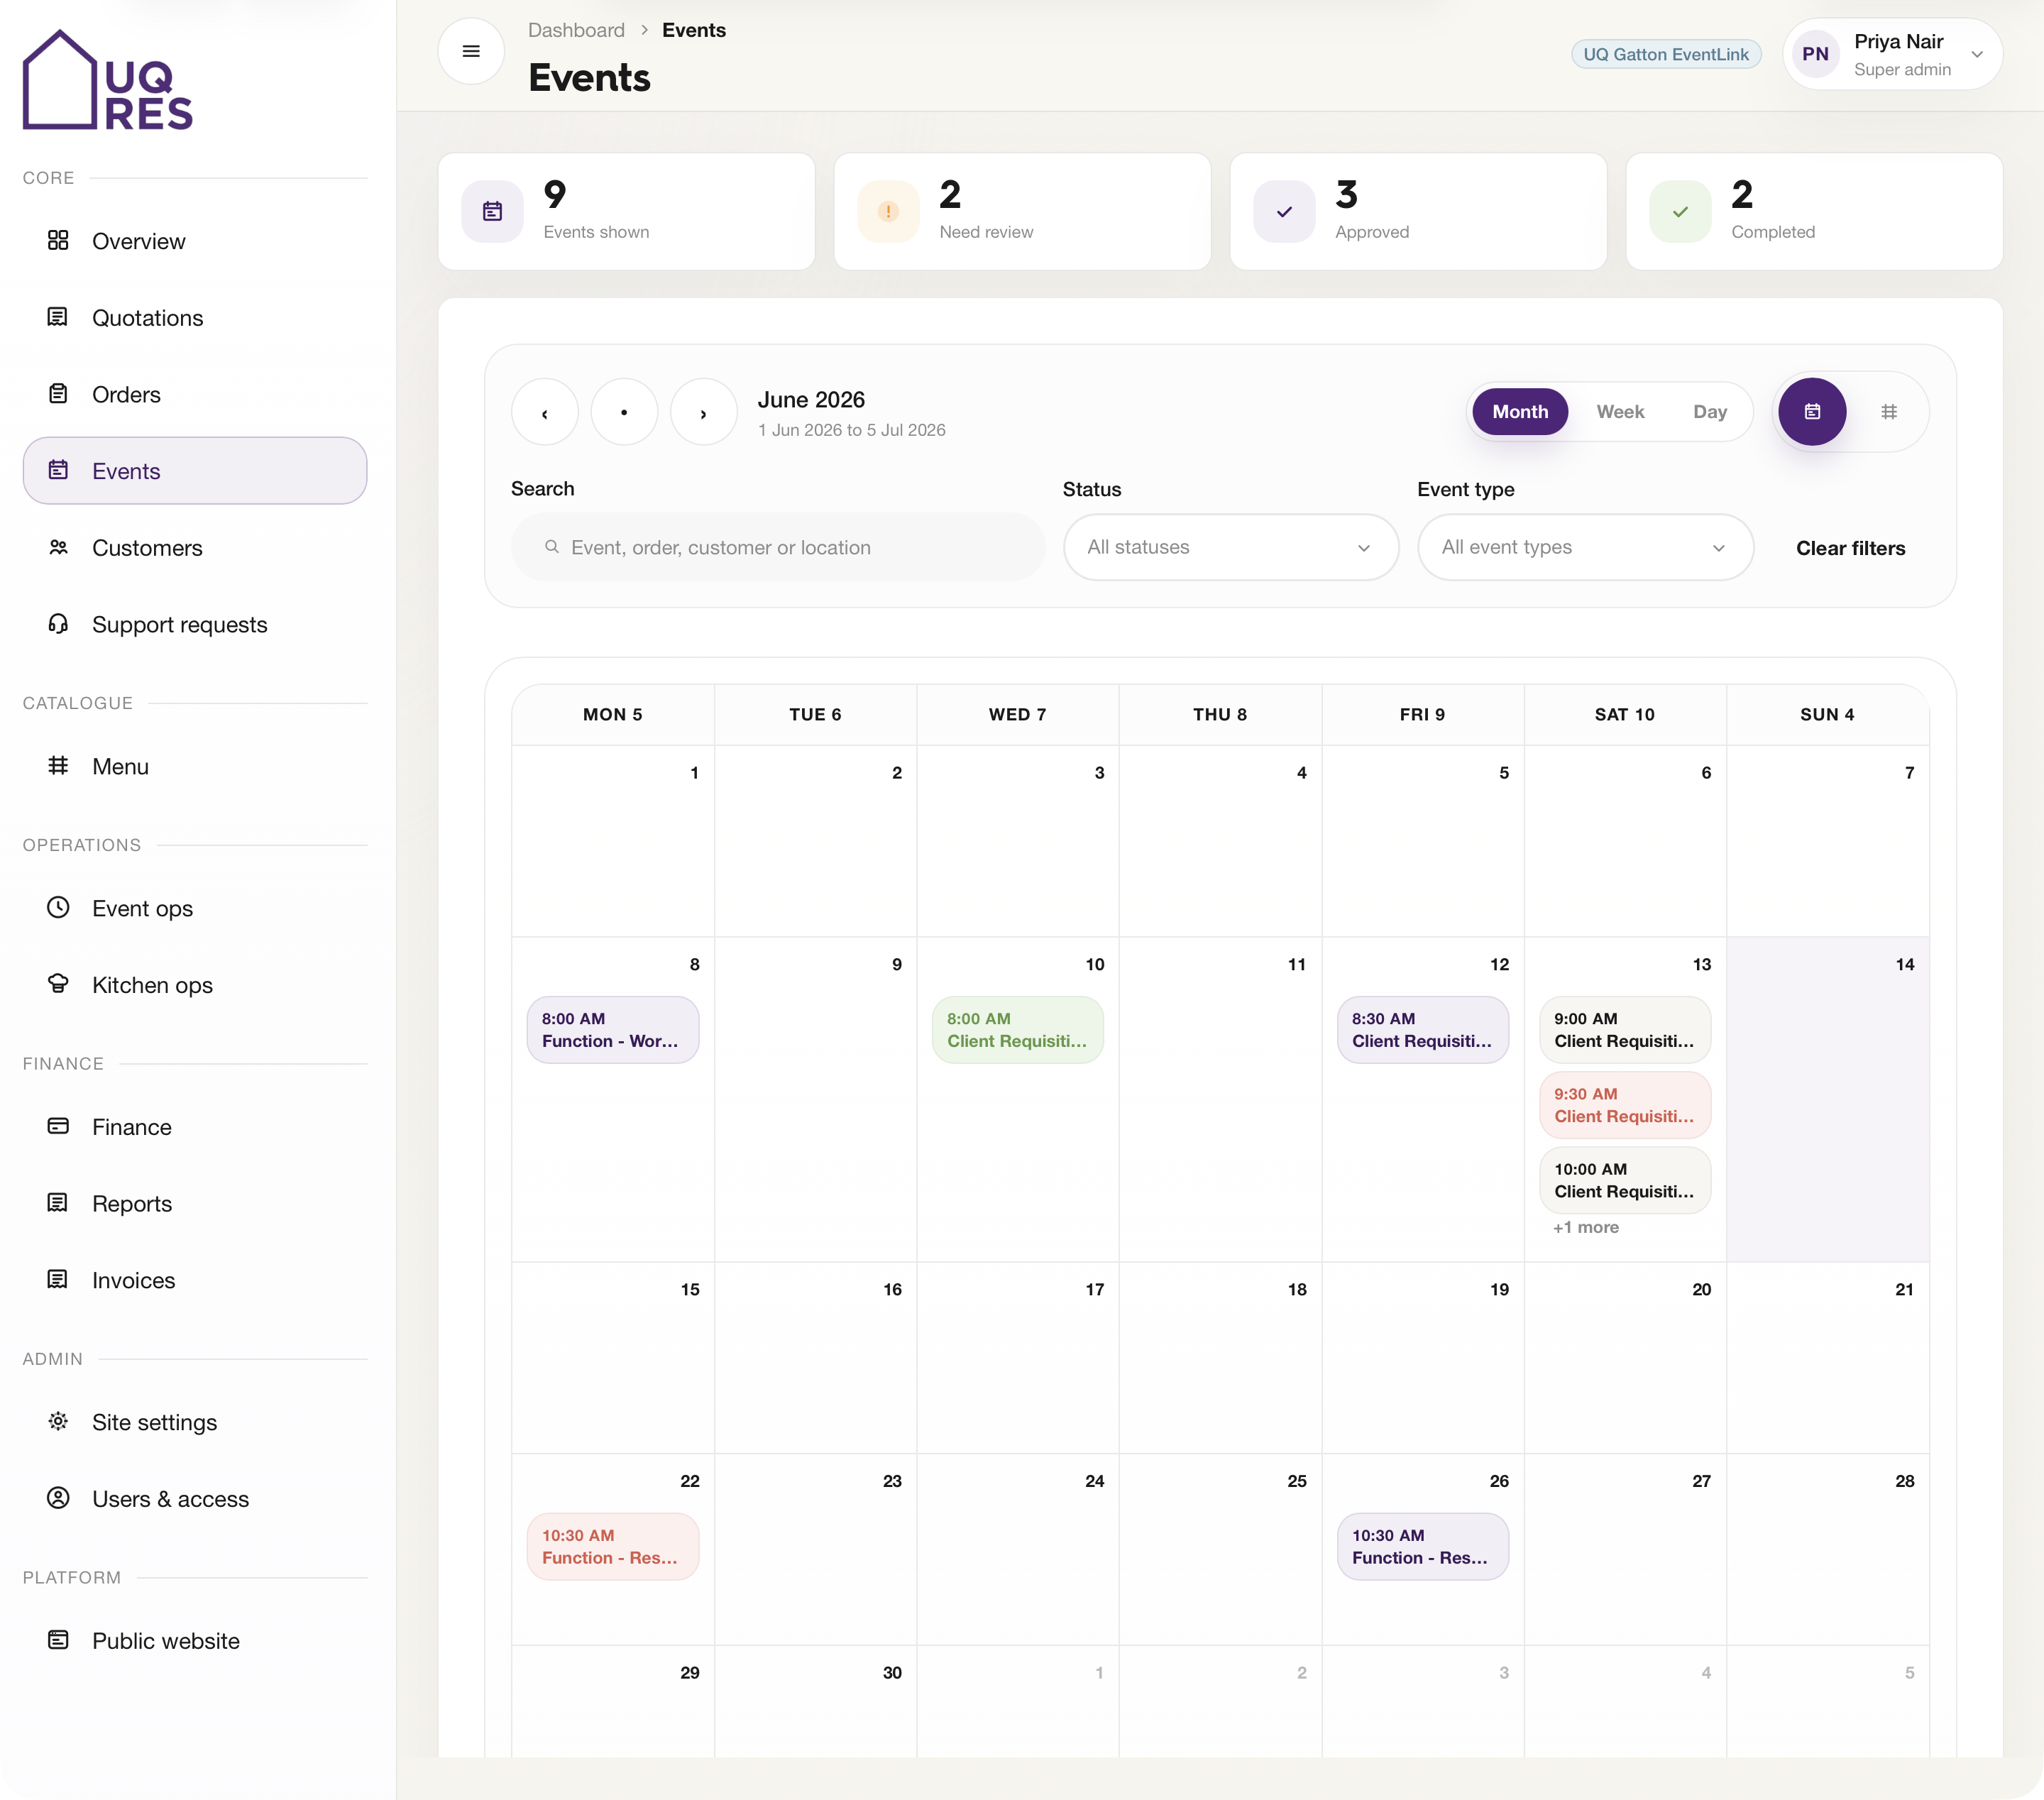
A web-based events and hospitality platform for Cater Care, connecting public ordering, quotations, event review, kitchen prep, finance, reporting, and catalogue sync.
View case study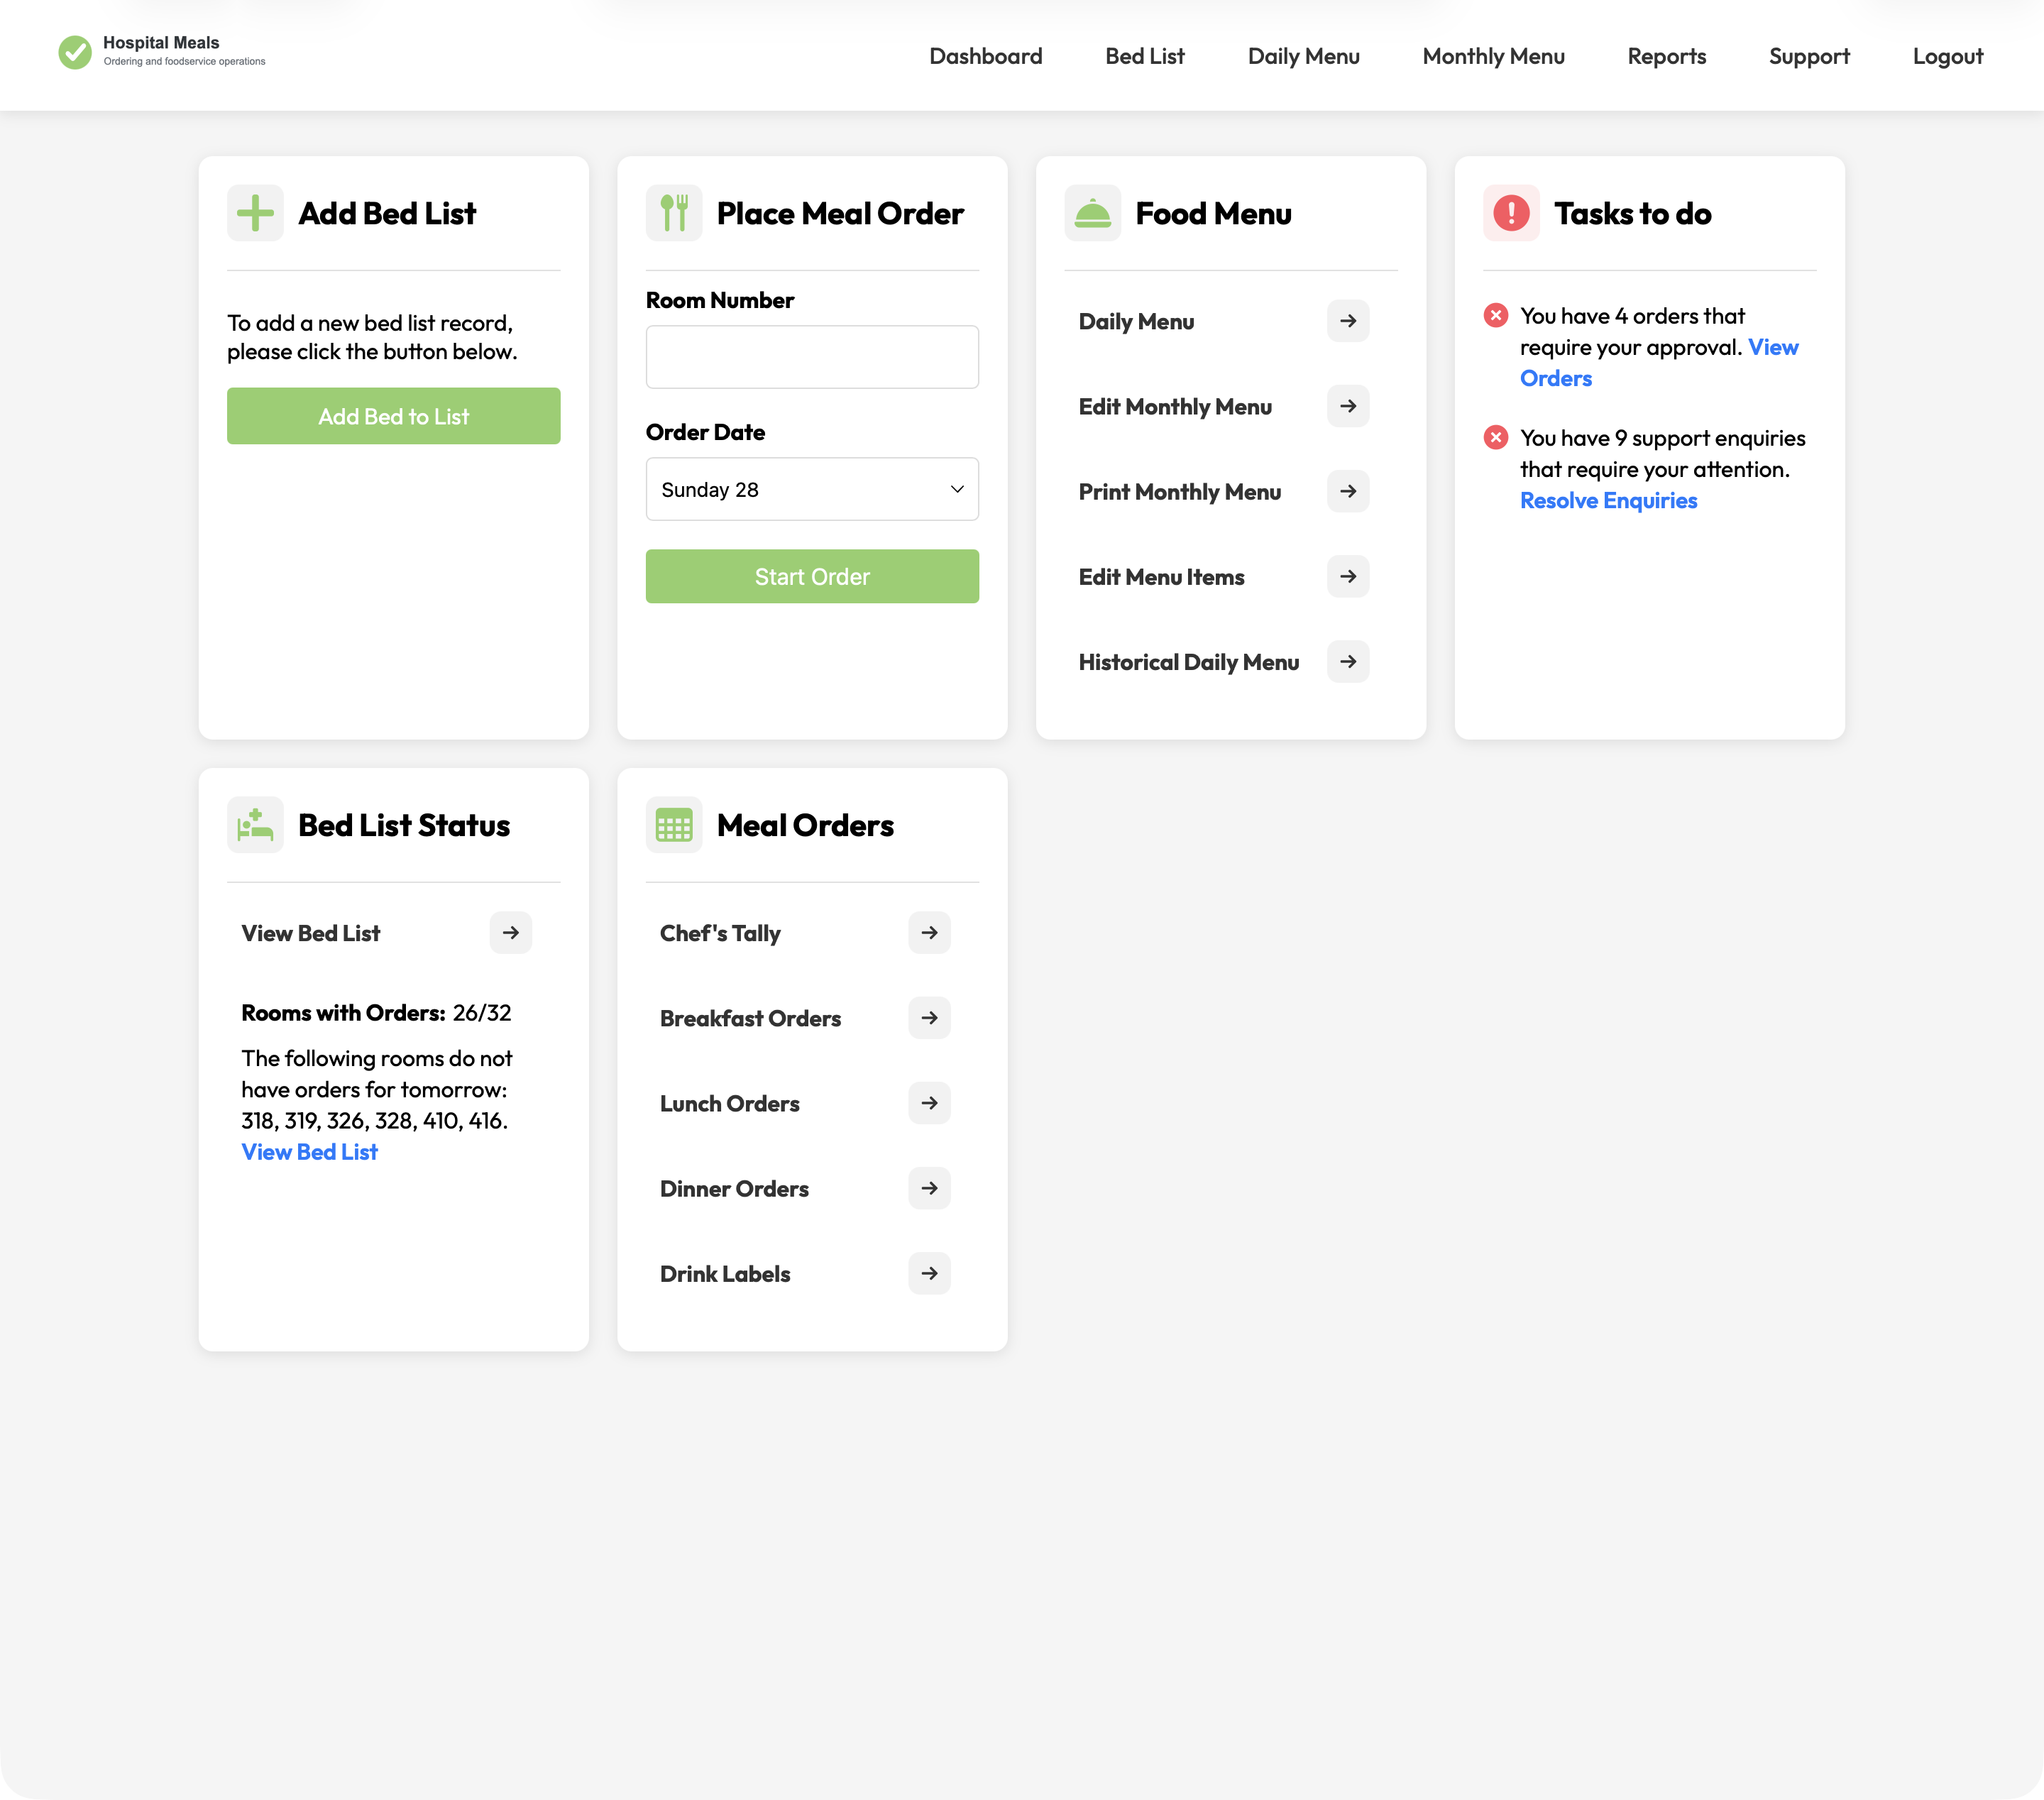
A hospital foodservice platform connecting patient meal ordering with bed lists, dietary context, menu cycles, approvals, kitchen views, tallies, labels, and PDFs.
View case study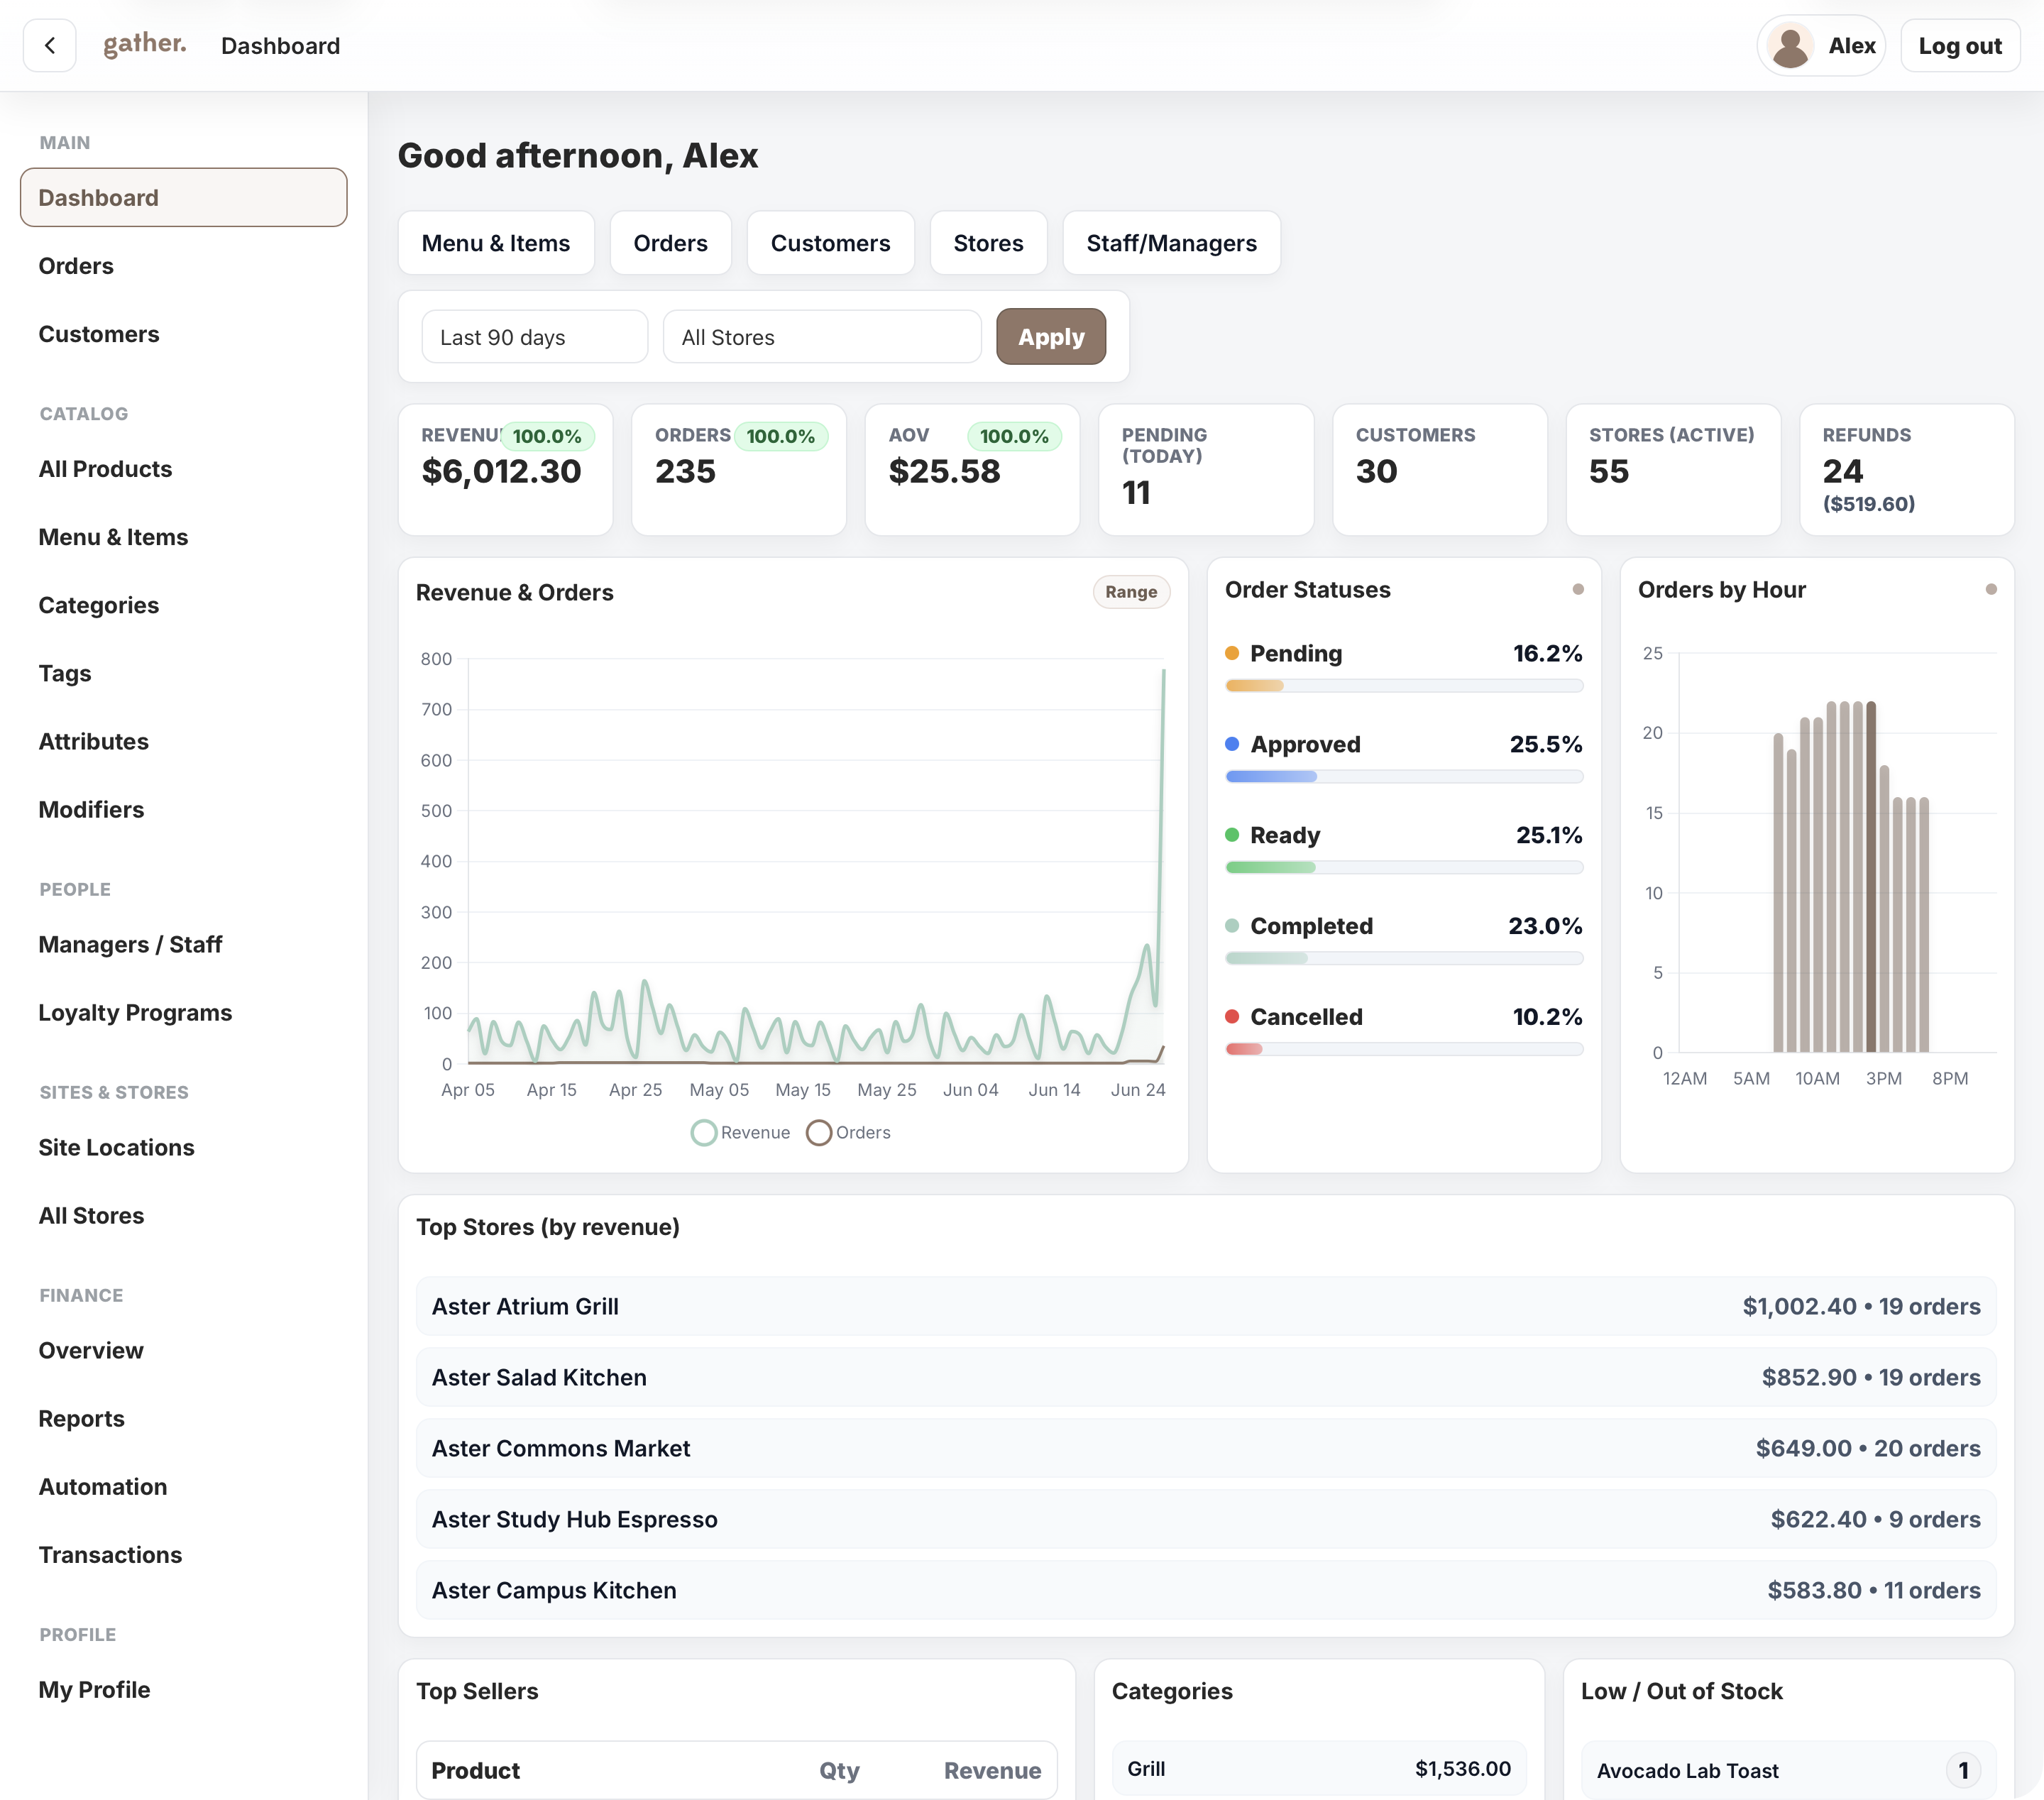
A campus commerce platform for Cater Care, connecting mobile ordering, outlet operations, payments, POS sync, loyalty, reporting, and head-office control.
View case studyA short list of the things teams usually ask before scoping reporting or analytics systems.
It can include dashboards, data connections, filters, trend views, exception alerts, exports and scheduled reports.
Yes. Reporting should start with useful business questions, not every available data point.
Yes. Reporting systems often pull from several tools or databases.
Yes, where the data and reporting rules are clear enough to structure properly.
Bring the reports, data sources and decisions that matter. Webits can help shape the right analytics system.