Operations leads
Managers who need a clean view of status, workload, exceptions and performance.
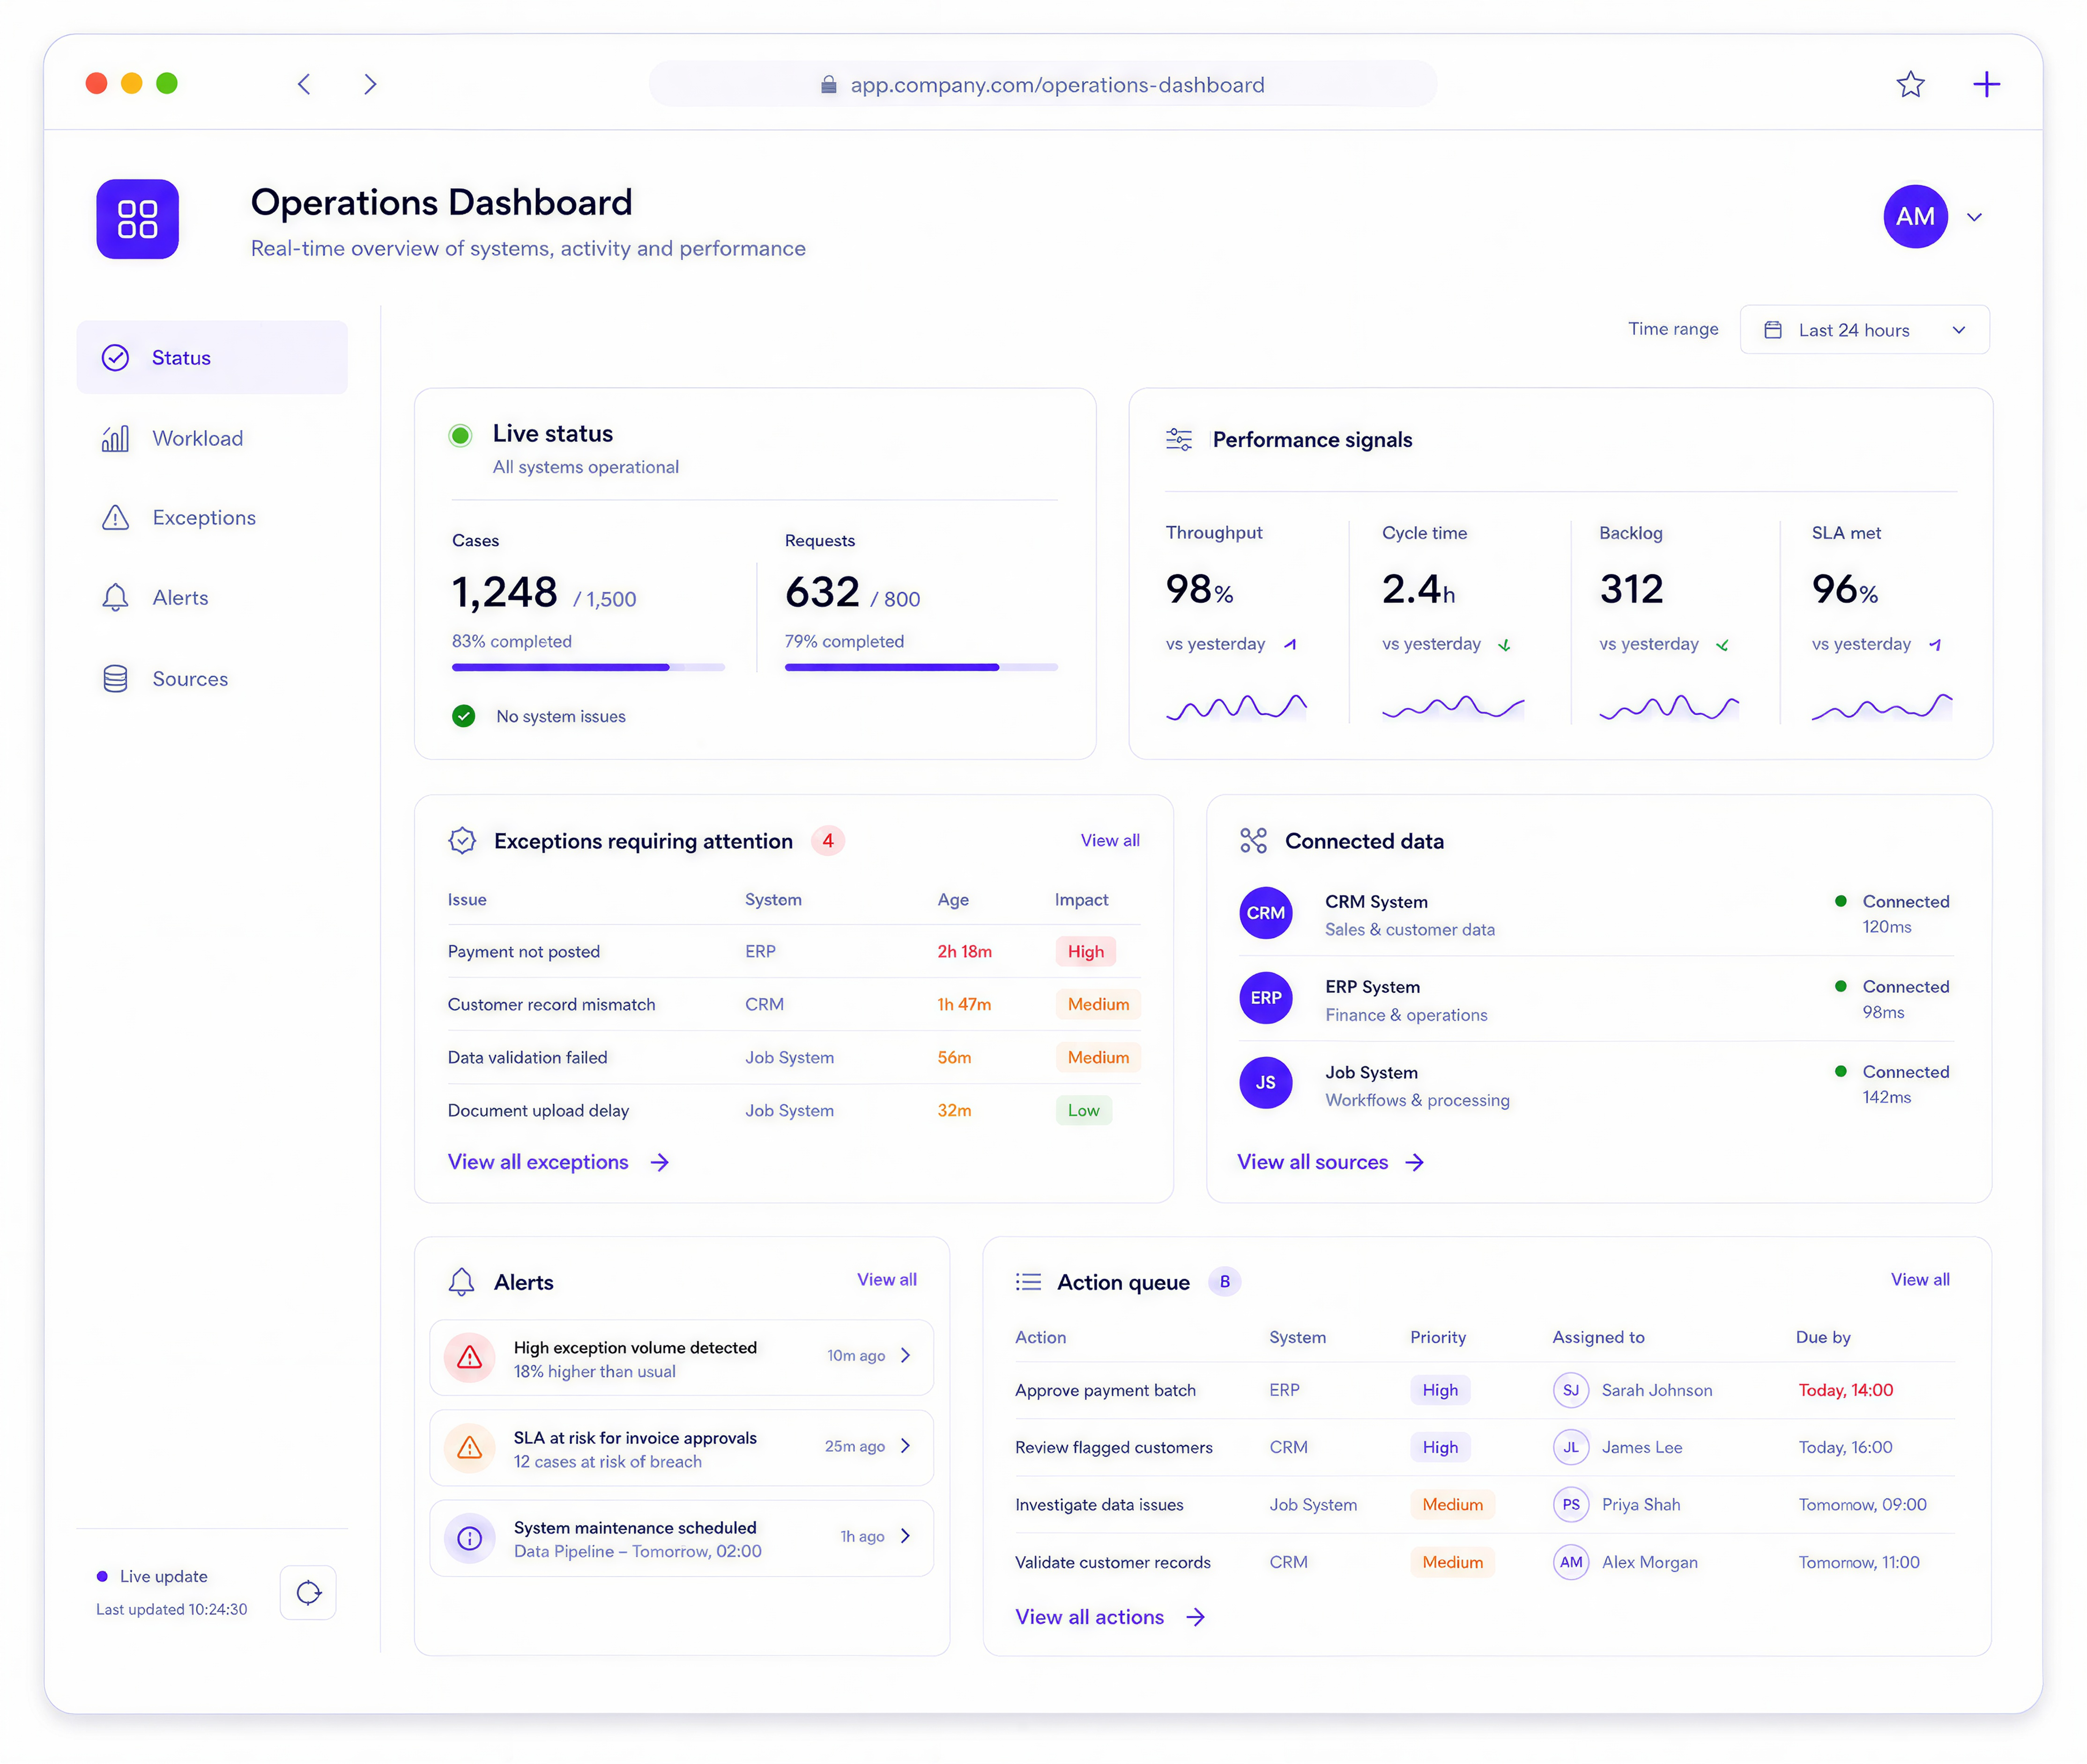
Webits builds operations dashboards that give teams a cleaner view of activity, status, workload, exceptions and the signals that need attention.
A dashboard should help the business see what matters, not overwhelm people with every possible number.
Webits plans dashboards around the decisions teams need to make, the data they can trust and the actions that should happen next.
Managers who need a clean view of status, workload, exceptions and performance.
Teams running jobs, requests, orders, bookings, support queues or delivery activity.
Companies with important signals spread across several systems or spreadsheets.
The useful parts depend on the data sources, team roles and operational decisions involved.
Clear views for workload, jobs, requests, orders, cases, exceptions or service activity.
Metrics that help the team understand movement, pressure and improvement areas.
Flags for delays, overdue work, blocked items, unusual activity or risk points.
Links to CRMs, ERPs, job systems, portals, databases or reporting sources.
Notifications or prompts when thresholds, exceptions or key events need attention.
Operational lists that help teams move from insight into the next action.
These are common signs an operations dashboard could give the team a stronger operating view.
Useful information sits across tools, exports, spreadsheets or manual reports.
The team finds out about issues after they have already created pressure.
Managers need to separate what matters from background noise.
The dashboard shows numbers but does not help people decide what to do next.
The build starts by defining the useful signals, then turns them into a dashboard people can act on.
Clarify what the dashboard should help people see and decide.
Identify the sources, quality issues, ownership and update rhythm.
Shape dashboard layouts around scanning, comparison and action.
Develop the dashboard, data connections, filters and operational views.
Support rollout and improve the dashboard once real use shows what matters most.
A selection of digital products, platforms and business systems engineered for organisations that depend on technology every day.
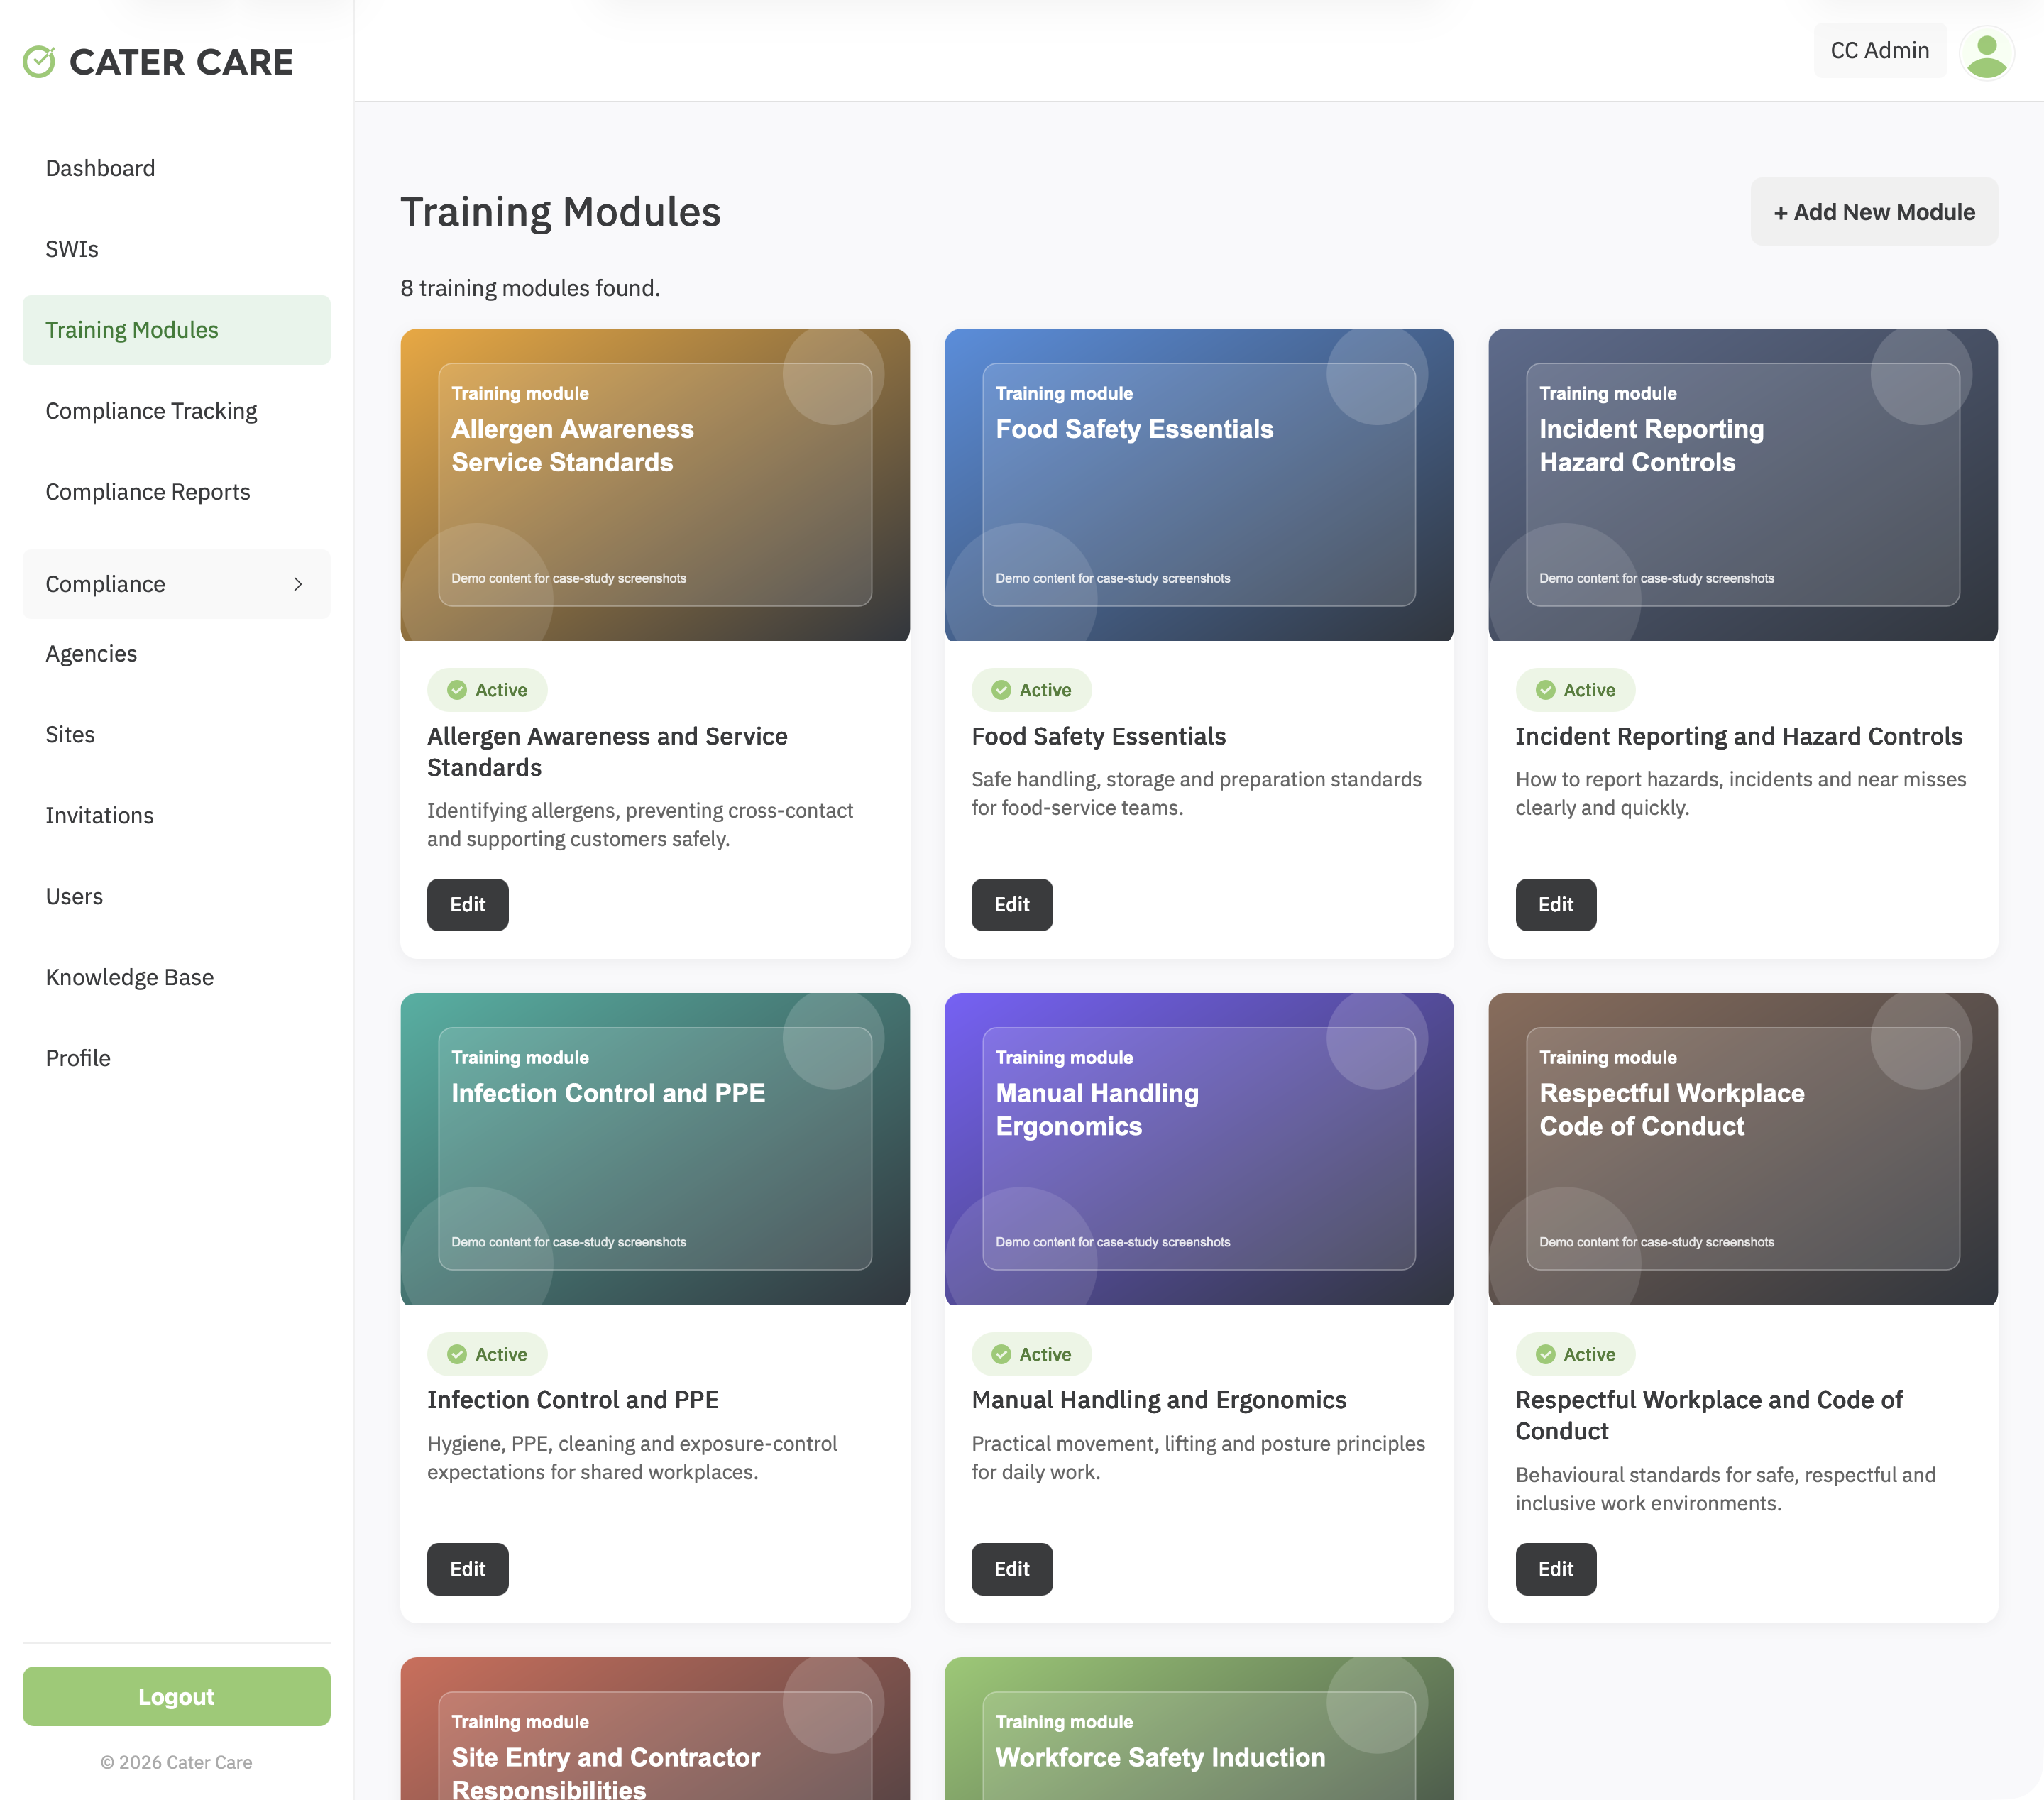
A workforce training and compliance platform for Cater Care, connecting custom SCORM delivery, SWI sign-off, VOC evidence, reporting, and role-based oversight.
View case study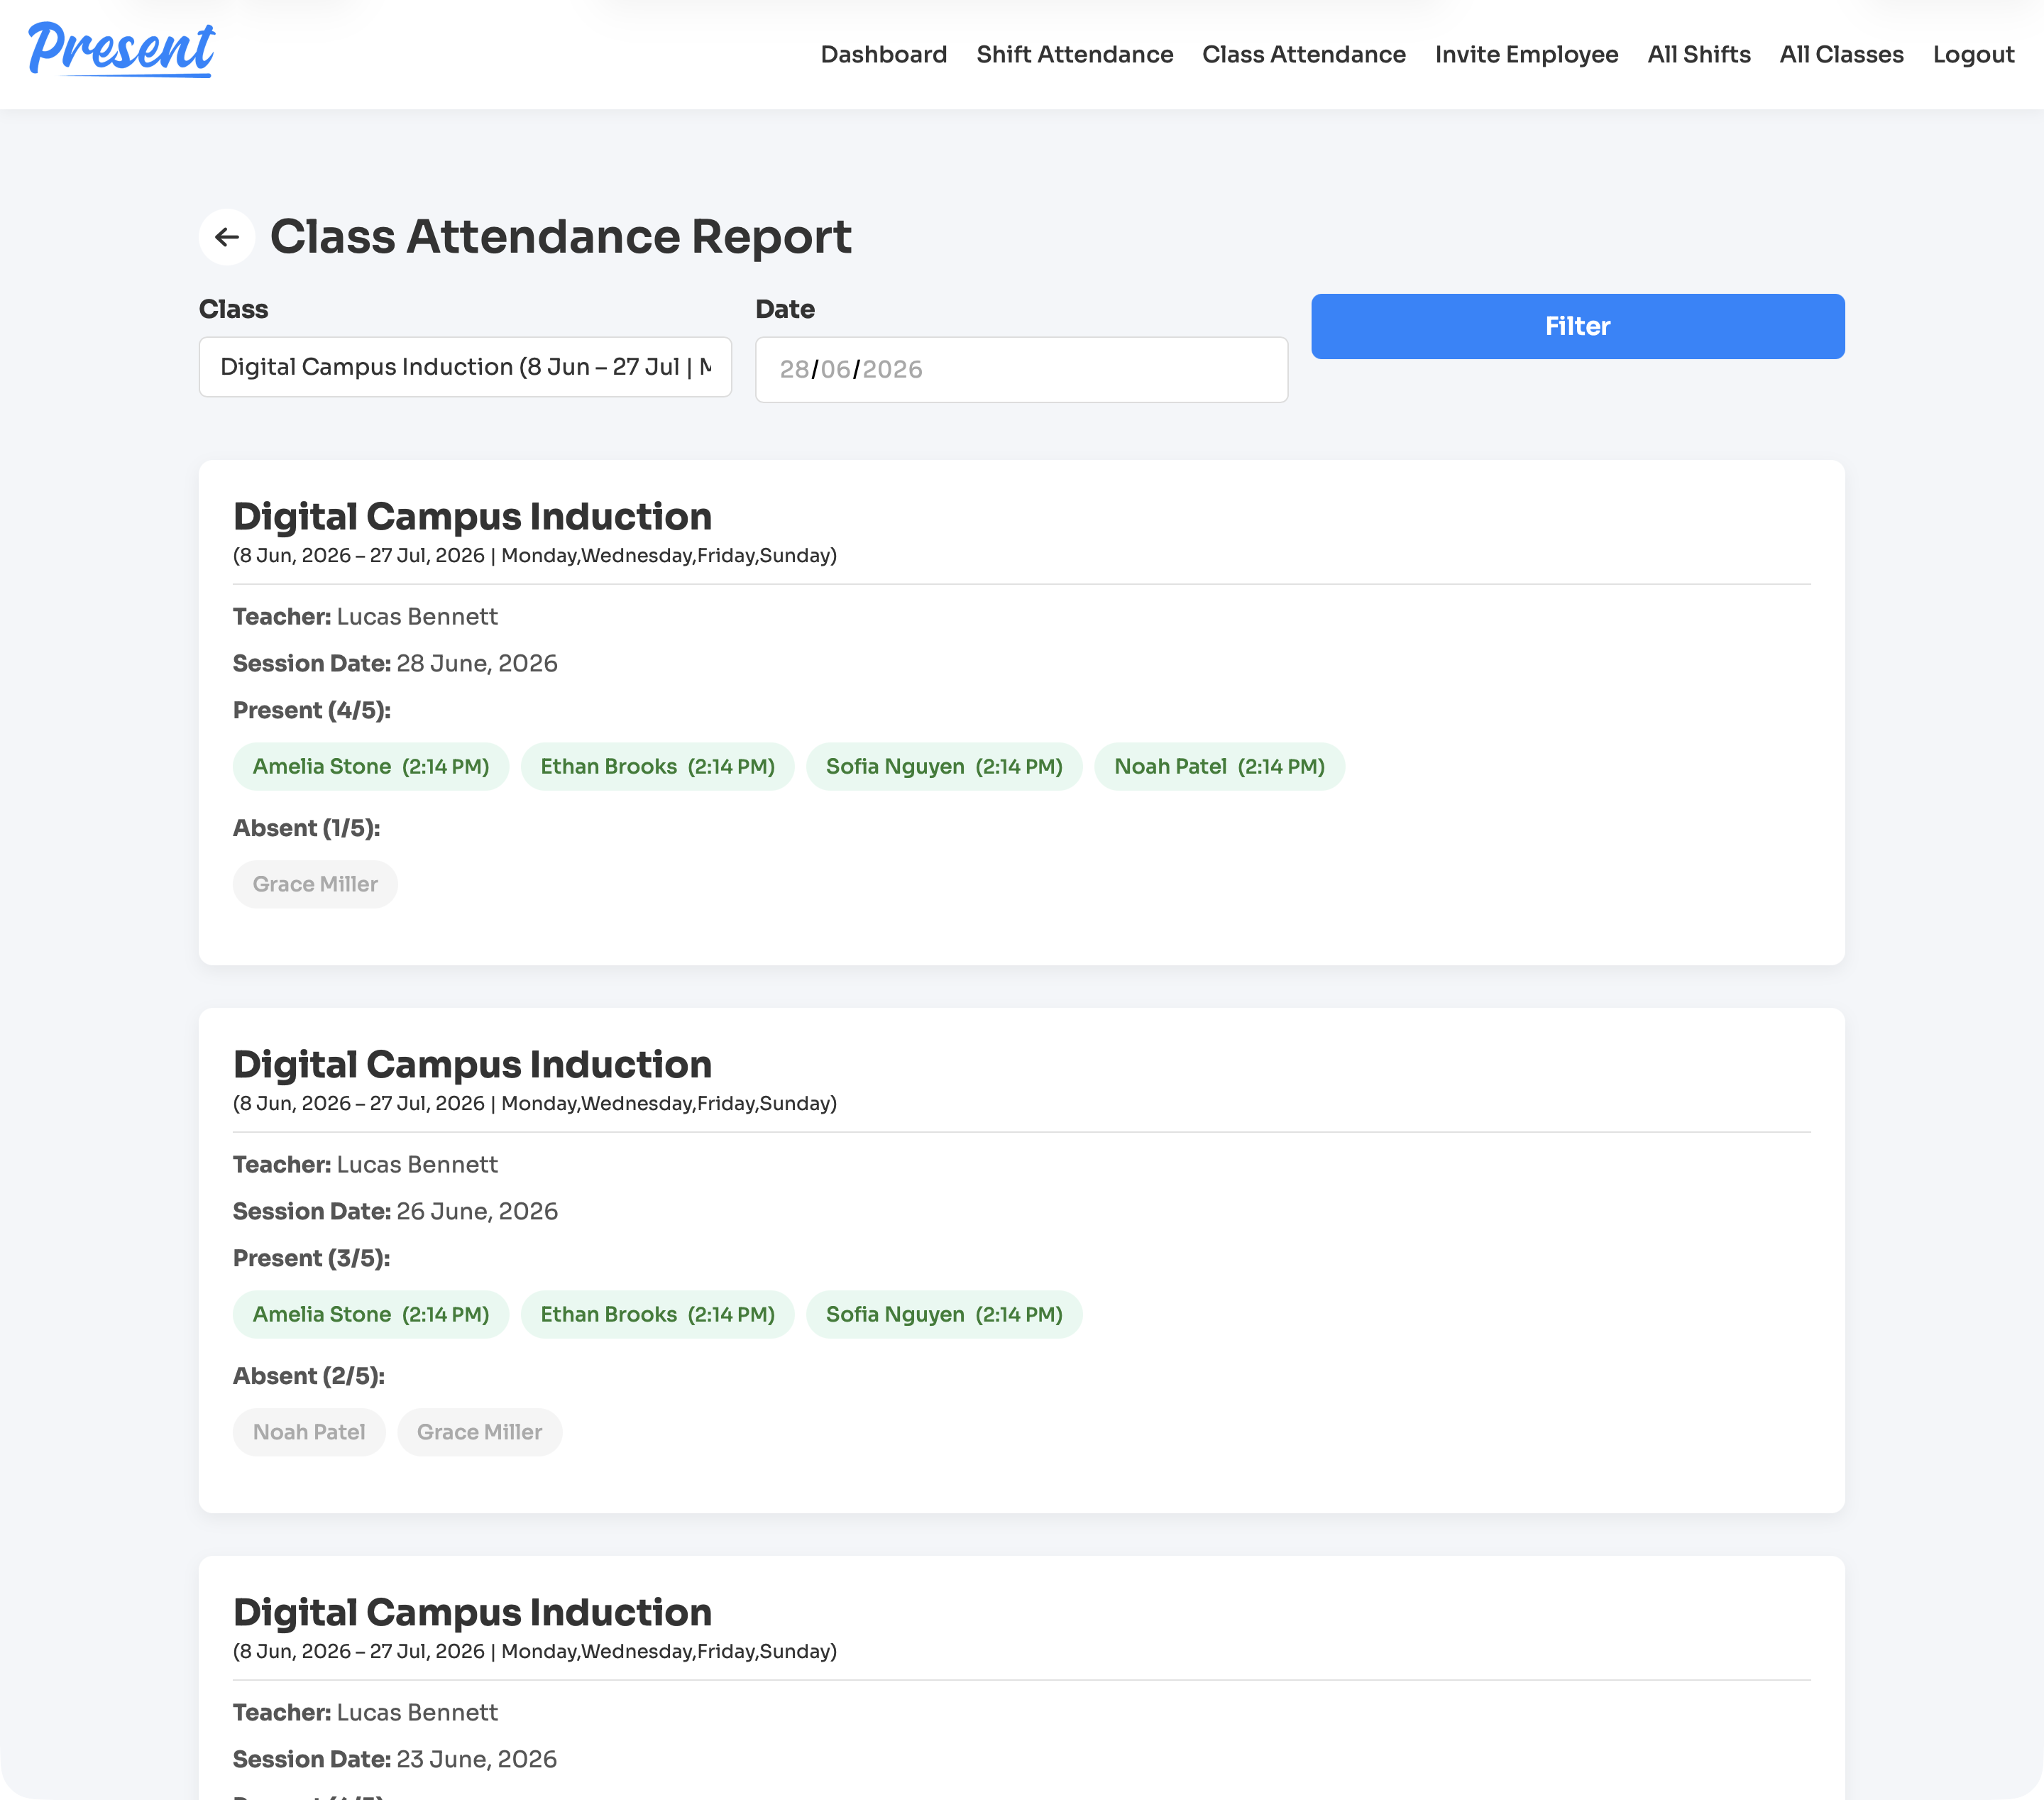
A web and iOS attendance platform for education providers, covering class rolls, staff shifts, geofenced clock-ins, cancellations, reports, notifications, and role-based admin control.
View case study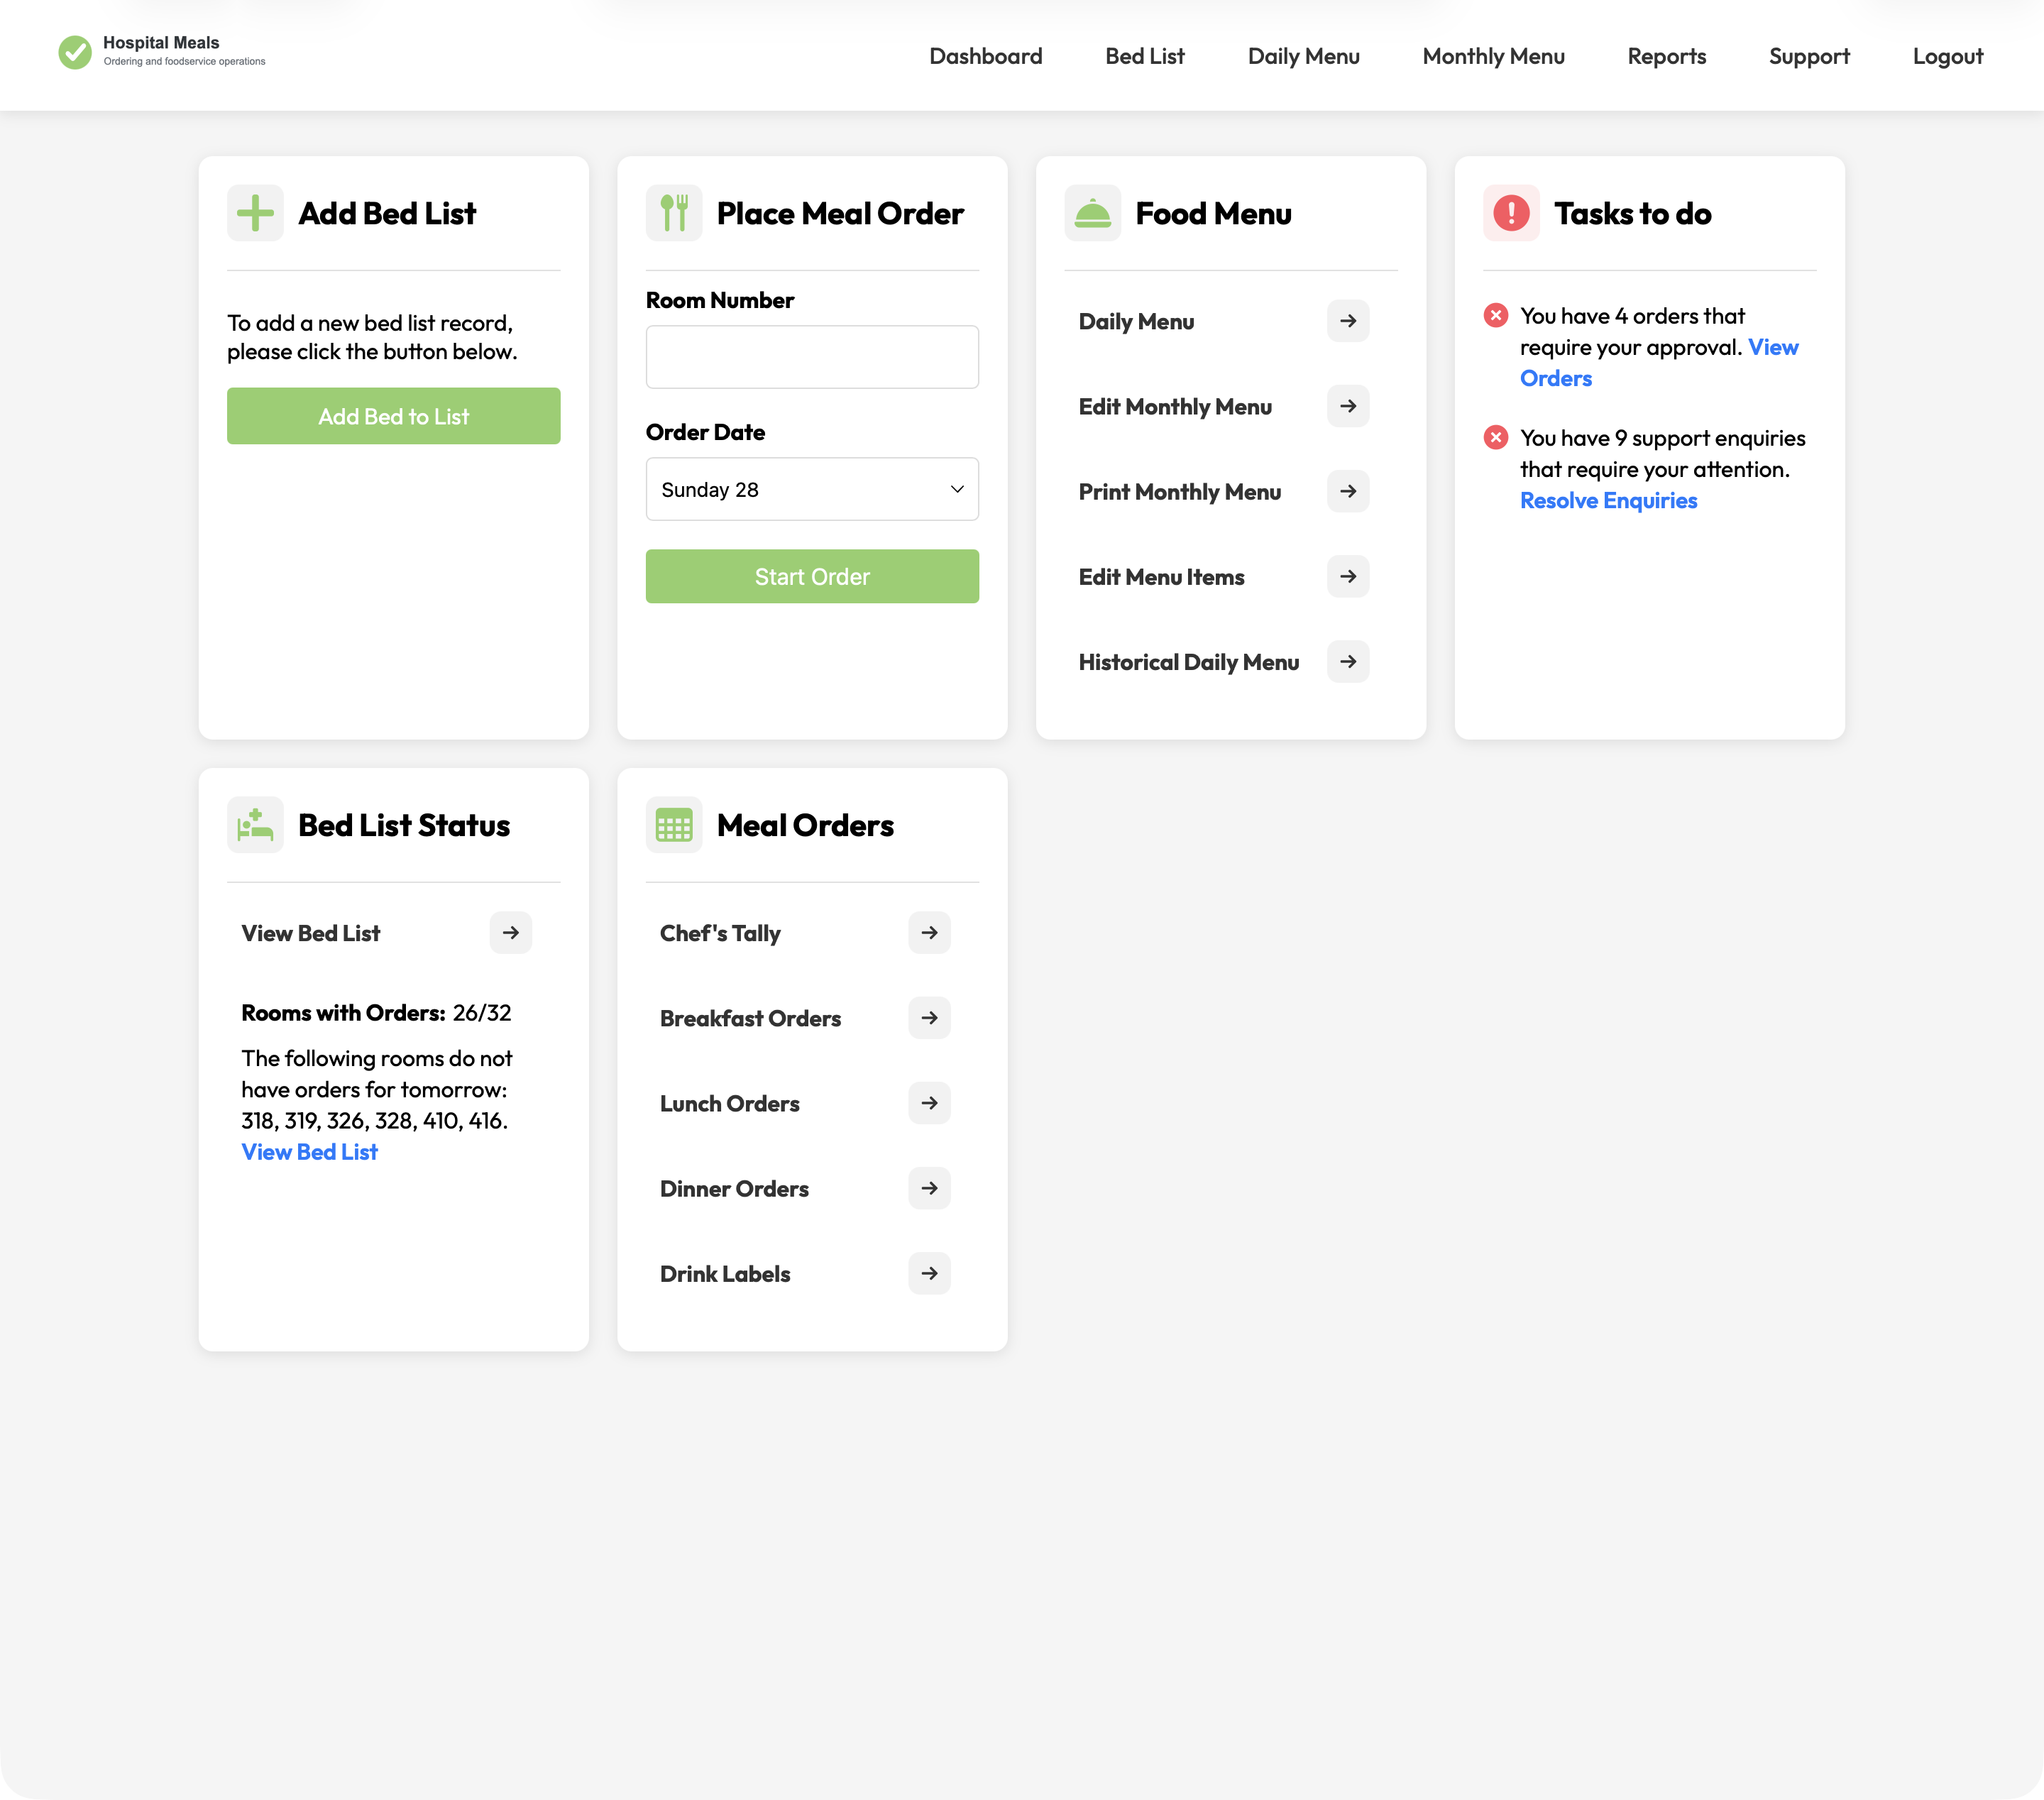
A hospital foodservice platform connecting patient meal ordering with bed lists, dietary context, menu cycles, approvals, kitchen views, tallies, labels, and PDFs.
View case studyA short list of the things teams usually ask before scoping an operations dashboard.
It can show workload, status, exceptions, performance, activity, queues, trends and operational signals.
Yes. Dashboards often need to draw from several systems or data sources.
Yes. The dashboard should be shaped around decisions, not just available data.
Yes. Alerts can be included where the team needs to respond to thresholds, delays or exceptions.
Bring the data sources, decisions and current reporting pain. Webits can help define the right dashboard scope.